Today's Tidbit... The 1926 Football Visualizer
America's first commercial radio broadcast came in November 1920, and the first football game broadcast came one year later. The number of radios and radio stations exploded over the next few years and by 1925, 19 million households owned radios. Radio became a primary method for fans to consume sports in the sports world. Like big-screen televisions today, radio allowed fans to enjoy games from the comforts of their home while consuming the food and beverages of their choice.
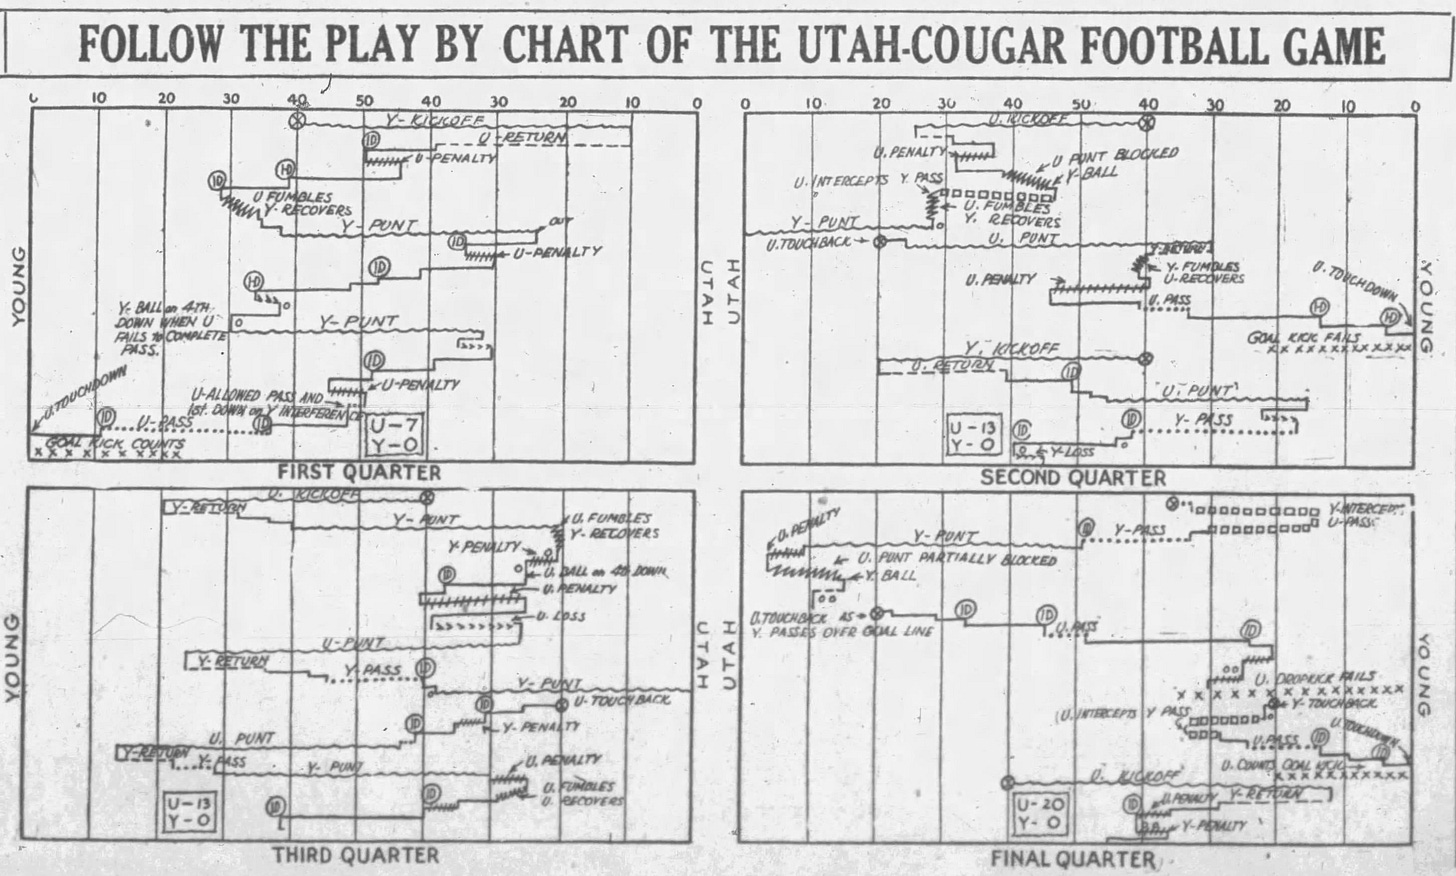
Of course, the primary shortcoming of listening to games on the radio was the lack of visual cues received in person. Fans in the stands could recall long runs, passes, or exciting plays and recognize the relative field position advantage one team had over the other, while fans listening on the radio had only their imagination until someone had the bright idea to encourage fans to chart the plays, just as sportswriters had done for decades, with newspapers replicating and publishing the play charts the following day.

While sportswriters charted plays to help craft their stories following the game, few fans did the same, despite a similar charting and scoring process being popular among baseball fans. Game programs and scorecards generally encouraged fans to track only those scoring points and the points scored by quarter.
That changed in 1926 when the WMAQ, a Chicago radio station owned by the Chicago Daily News, published their Football Visualizer, which fetched 10 cents per copy (equal to $1.76 today).

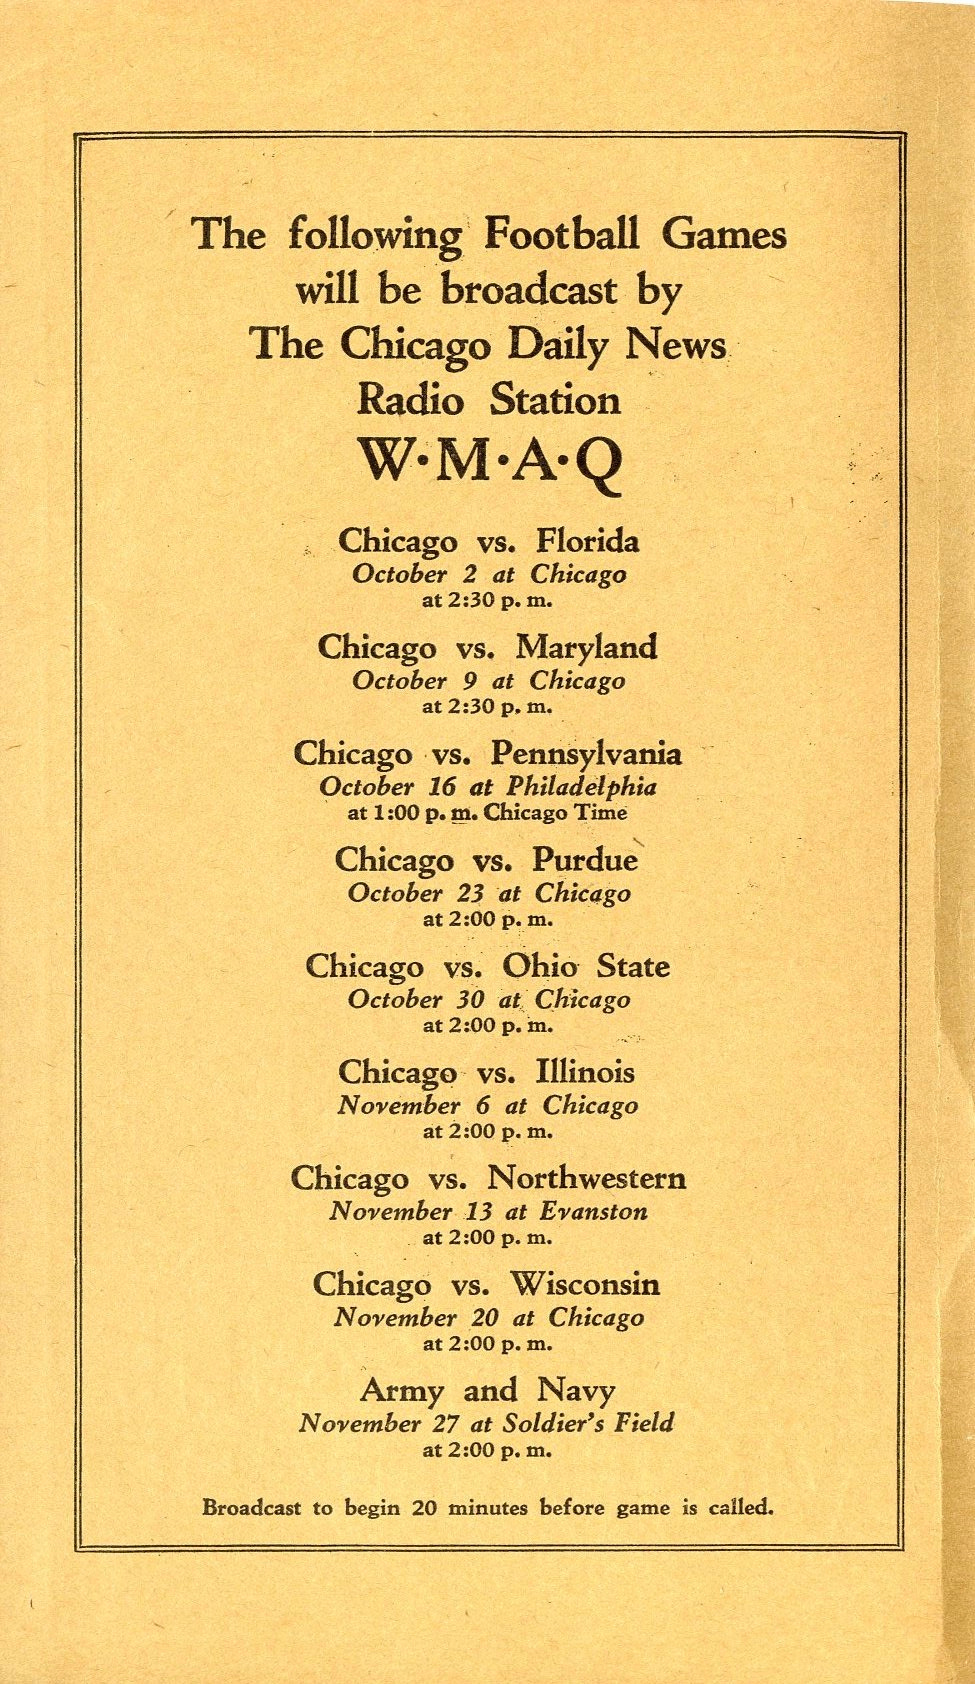
Besides having fantastic cover artwork, the Visualizer promoted the station's broadcasts of University of Chicago games and the Army-Navy game scheduled for Soldier Field at season's end.
As they argued in the directions below, charting the plays helped the radio listener visualize the game's ebbs and flows. Tracking the scoring, number of completed and incomplete passes, and the like also added to fans' enjoyment of the game, particularly if fans used the suggested symbols to distinguish ball movements resulting from runs, passes, punts, or kicks.
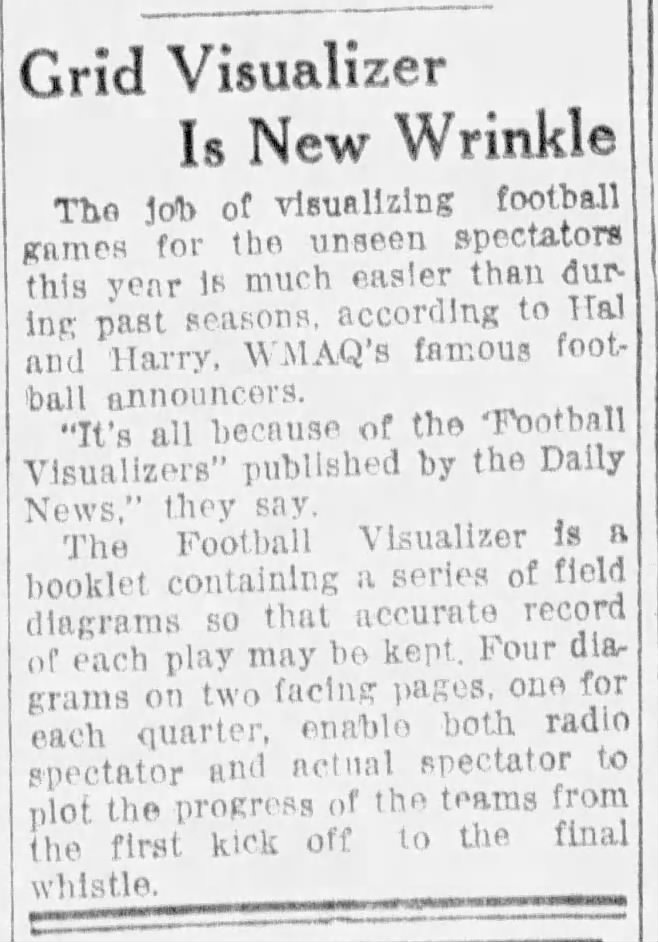
The Chicago Daily News Football Visualizer received a patent in 1926 and gained some publicity among other newspapers during the 1926 season.
Unfortunately for the Visualizer believers, charting games in the stands or at home did not catch on with fans, not even the original owner of this Visualizer. As seen below, the owner started filling out the 1926 Chicago-Ohio State game information but quickly gave up and did not record a single play.

A similar system popped up in 1929 when the Earl Radio Company, a manufacturer based in Toledo and owned by Walter Chrysler, promoted their visualizer booklet. Although Chrysler's auto products roll down the road today, Earl Radio disappeared with the crash in 1929, and their Visualizer went with them.
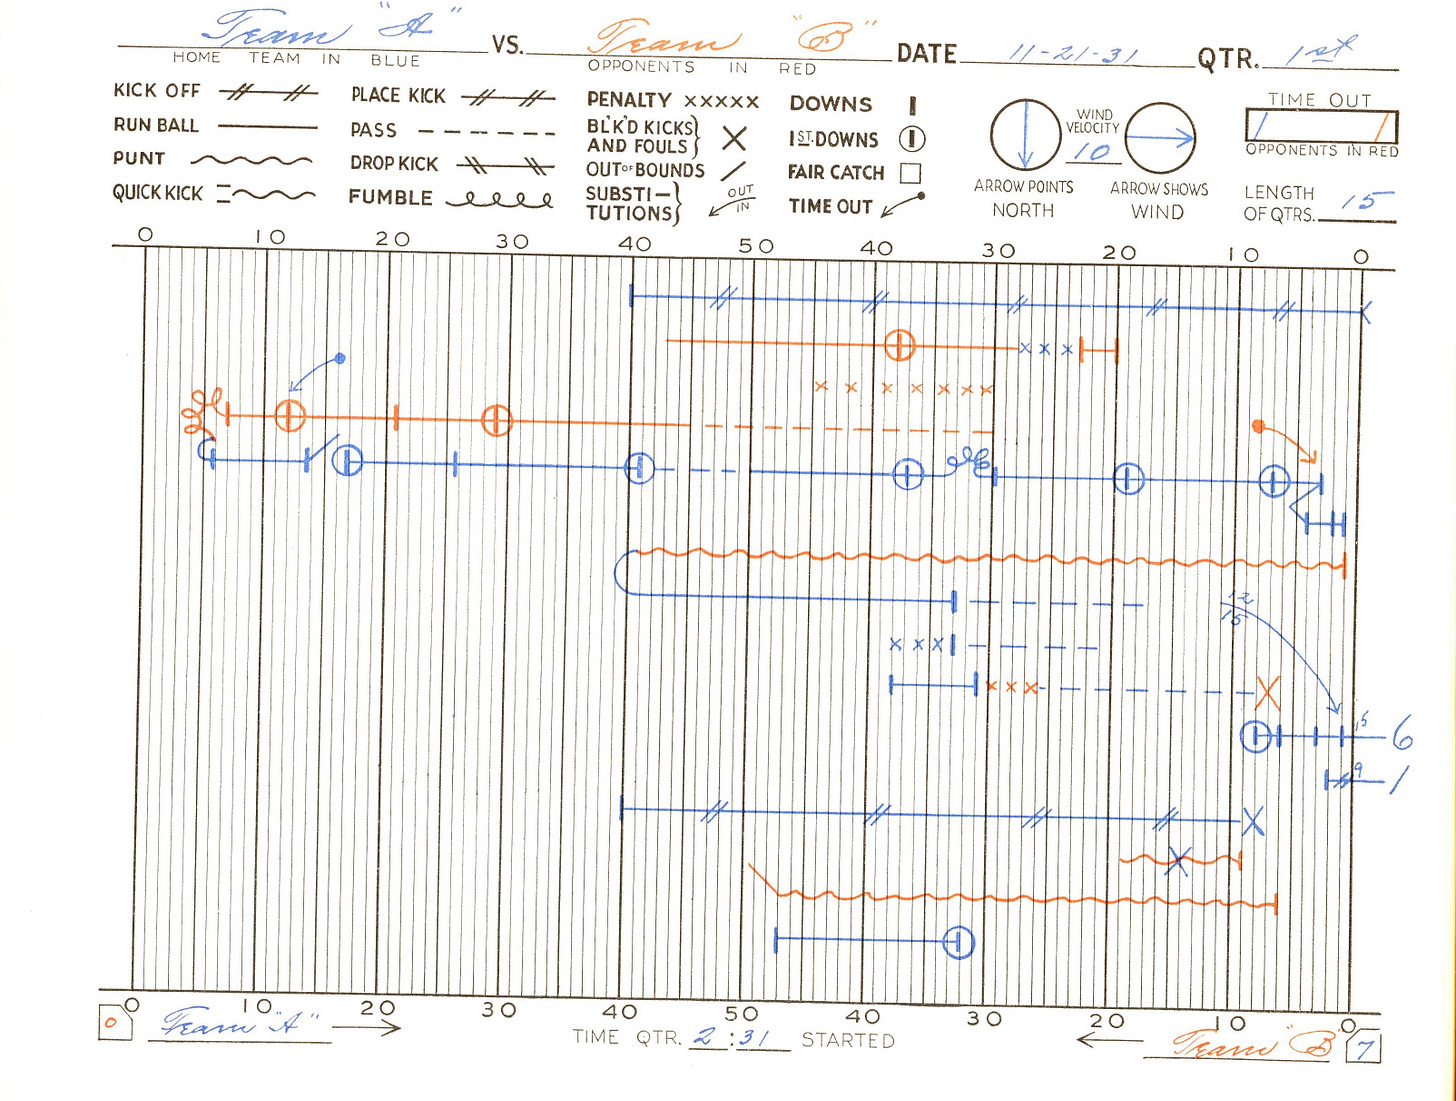
The Football Visualizer reappeared in 1947 in a Philadelphia Inquirer sporting goods store ad. Still, it likely was a full scorebook of the type sportswriters and team statisticians used, such as the 1932 example shown below.
In recent decades, many JV quarterbacks followed their high school coaches along the sideline while charting the varsity play calls. However, outside of press members and statisticians, few remain alive today that have used a Visualizer or similar system to track a football game.
Let us know if you have used one and the circumstances for doing so.
Football Archaeology is reader-supported. Click here to buy one of my books or otherwise support the site.


I've never used a visualizer, but back in 1972 I bought "Pro Football Review" by Sports Illustrated, a detailed statistical review of the 1971 NFL season. It contained a chart of every game of the '71 season - the charts looked similar to the Visualizer. Here is an example: https://www.dropbox.com/scl/fi/a8tkh9w6aowwtbxkvrxqp/chart.pdf?rlkey=nw3wdmzeou4ykh66vnwy1978t&dl=0
Passes were dashed lines, runs were solid lines. I think I can dig up the 'key' with all the details, and maybe the whole book. Let me know if you're interested.